Bitcoin Price Update: BTC Holds Near $59,972 as Sellers Test $58.9K Support


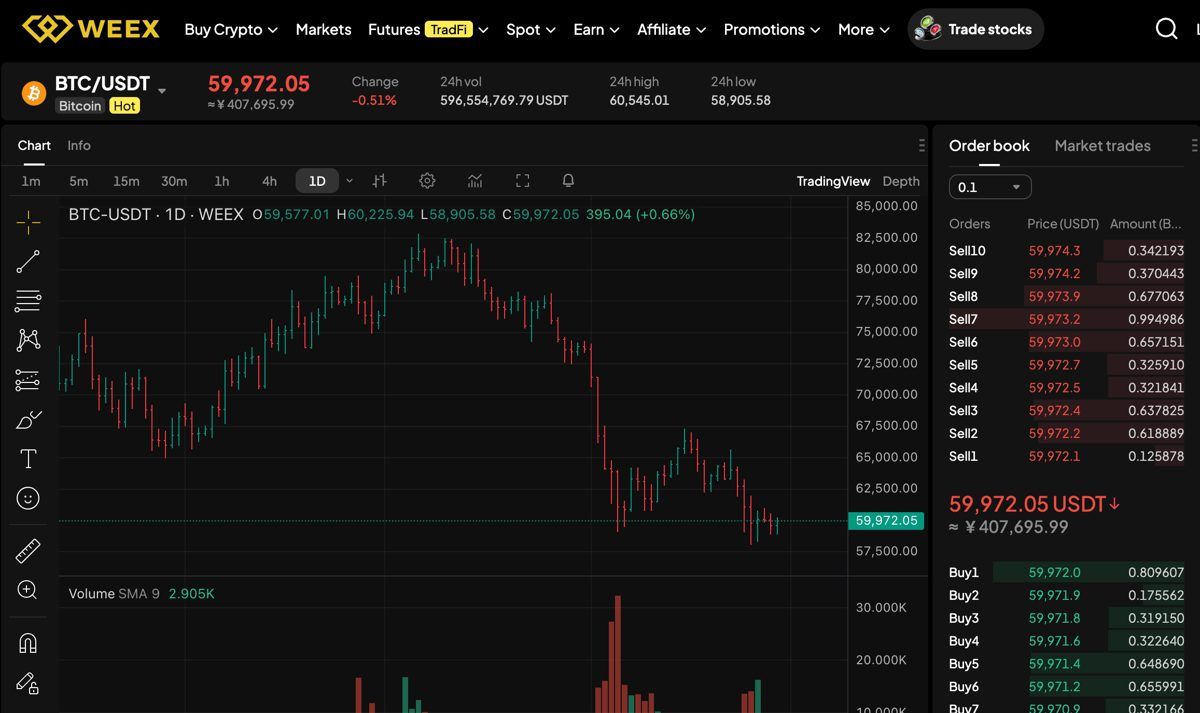
Bitcoin is trading near $59,972.05 on the BTC/USDT spot market after a 0.51% 24-hour decline. The latest WEEX market view shows 24-hour volume around 596,554,769.79 USDT, with BTC moving between a low of $58,905.58 and a high of $60,545.01.
The short-term setup remains cautious. BTC is holding near the $60,000 psychological area, but the daily chart still shows sellers pressing the market after a broader decline from higher levels. Users who want to follow Bitcoin markets directly can create a WEEX account and monitor the BTC/USDT spot market as price tests support near $58.9K.
Bullet Summary
- Current price: $59,972.05
- 24-hour change: -0.51%
- Current support: $58,905.58 to $59,000
- Current resistance: $60,545.01 to $61,000
- Trend view: range-bound with a bearish tilt unless BTC reclaims $61,000
- Next key level: $61,000 on the upside, $58,905.58 on the downside
What Is Driving Bitcoin Price Today?
Bitcoin price is being shaped by weak short-term momentum, cautious spot demand, and the market's struggle to rebuild strength above the $60,000 area. The 24-hour high near $60,545.01 shows that buyers attempted a rebound, but the move has not yet turned into a confirmed breakout.
The daily chart also matters. BTC has been moving lower from the recent upper range, and the current candle is still near the lower side of the visible structure. That keeps traders focused on whether $58,905.58 can hold as short-term support.
Bitcoin Price Eyes Recovery
A recovery path for Bitcoin starts with holding the $58,905.58 to $59,000 support band. If buyers defend that zone and push BTC back above $60,545.01, the next important test would be the $61,000 area. A stronger move through $61,000 could improve momentum and bring $62,500 back into focus.
For now, the recovery case still needs confirmation. BTC needs more than a quick bounce. Traders should watch whether price can hold above $60,000, whether volume improves during green candles, and whether sellers fade near resistance.
Another Drop?
The bearish case becomes stronger if BTC loses the $58,905.58 support level. A clean break below that area would show that buyers are not defending the current range, which could open the door to another test of lower liquidity zones.
If BTC repeatedly fails around $60,545.01 to $61,000, short-term traders may treat rallies as selling opportunities. In that case, Bitcoin could remain under pressure even if it briefly moves back above $60,000.
Key Support and Resistance Levels
| Level | BTC price zone | Why it matters |
|---|---|---|
| Immediate support | $58,905.58 to $59,000 | Recent low area and first zone buyers need to defend |
| Near-term resistance | $60,545.01 to $61,000 | Recent 24-hour high and first recovery barrier |
| Bullish extension | $62,500 | Potential upside level if BTC breaks resistance with volume |
| Breakdown watch | Below $58,905.58 | Would weaken the range and confirm renewed selling pressure |
Market Data to Watch
| Metric | Current reading | Trader focus |
|---|---|---|
| Spot price | $59,972.05 | Whether BTC can hold the $60,000 area |
| 24h change | -0.51% | Shows mild short-term selling pressure |
| 24h high | $60,545.01 | First level buyers need to reclaim |
| 24h low | $58,905.58 | Key support for the current range |
| 24h volume | 596,554,769.79 USDT | Watch whether volume rises during any breakout attempt |
Technical Indicators
| Indicator | Current read | What traders should watch |
|---|---|---|
| MACD | Not confirmed from the screenshot | Watch for a bullish crossover before trusting a recovery |
| RSI | Not confirmed from the screenshot | Check whether BTC is stabilizing or still weakening |
| Major support | $58,905.58 to $59,000 | Loss of this zone would favor sellers |
| Major resistance | $60,545.01 to $61,000 | Break above this zone would improve the short-term setup |
Bullish and Bearish Scenarios
| Scenario | Trigger | Possible BTC reaction |
|---|---|---|
| Bullish recovery | BTC holds $59,000 and breaks above $61,000 | Price may retest $62,500 if volume supports the move |
| Range-bound trade | BTC stays between $58,905.58 and $61,000 | Short-term traders may focus on support and resistance reactions |
| Bearish breakdown | BTC loses $58,905.58 | Price could test lower support as sellers regain control |
What This Means for Traders
BTC is not showing a confirmed trend reversal yet. The market is tradable, but the setup favors patience around clear levels. Spot traders may prefer waiting for confirmation near $59,000 support or a stronger breakout above $61,000 before increasing exposure.
Risk control matters because Bitcoin can move sharply around psychological levels such as $60,000. Traders should avoid relying on one candle, watch order execution around key levels, and size positions according to the risk of a break below support.
How to Trade Bitcoin on WEEX: Step by Step Guide
- Step 1: Go to the WEEX official website and create your WEEX account.
- Step 2: Deposit funds by transferring crypto from your wallet or buying through WEEX Quick Buy.
- Step 3: Go to the spot section and search for the BTC/USDT trading pair.
- Step 4: Enter the amount of BTC you want to buy or sell and place your order.
- Step 5: Secure your Bitcoin. You can move BTC to your own wallet or keep it on WEEX only for active trading.
Bottom Line
Bitcoin is currently range-bound with a bearish tilt. BTC is holding near the $58,905.58 to $59,000 support area, but buyers still need to reclaim $60,545.01 to $61,000 before the chart looks healthier. A move above $61,000 would improve the recovery outlook, while a break below $58,905.58 would put sellers back in control.
Before you go: you can learn about the WEEX Token (WXT) for ecosystem participation, and new users may explore the WEEX welcome bonus with limited-time rewards such as trading coupons and task-based incentives.
FAQ
1. What is Bitcoin price today?
Bitcoin is trading near $59,972.05 on the BTC/USDT spot market, based on the latest WEEX market view in the screenshot.
2. Is BTC bullish or bearish right now?
BTC looks range-bound with a bearish tilt. The price is holding near support, but it has not yet reclaimed the key resistance zone near $60,545.01 to $61,000.
3. What is the key support level for Bitcoin?
The main short-term support area is around $58,905.58 to $59,000. A break below that zone would weaken the current range.
4. What resistance should BTC traders watch?
BTC traders should watch $60,545.01 first, followed by $61,000. A stronger move above $61,000 could improve the recovery setup.
5. Can Bitcoin recover from here?
Bitcoin can recover if buyers defend the $59,000 area and push price above near-term resistance with stronger volume. Without that confirmation, rebounds may remain fragile.
6. Can I trade BTC on WEEX?
Yes. BTC/USDT is available as a spot market on WEEX, allowing users to buy and sell Bitcoin against USDT.
7. What should beginners watch before trading BTC?
Beginners should watch price support, resistance, volume, spread, liquidity, and broader market sentiment before entering a trade.
DISCLAIMER: WEEX and affiliates provide digital asset exchange services, including derivatives and margin trading, only where legal and for eligible users. All content is general information, not financial advice-seek independent advice before trading. Cryptocurrency trading is high risk and may result in total loss. By using WEEX services you accept all related risks and terms. Never invest more than you can afford to lose. See our Terms of Use and Risk Disclosure for details.
You may also like

Nike Stock Forecast: Why Is NKE Down to $39 and Will It Recover to $50?
Nike-linked NKEUSDT futures are trading near $39.507 after a sharp intraday drop, raising the question of whether Nike stock can recover toward $50. This guide explains why NKE fell, the key support and resistance levels, and what traders should watch before trading NKE futures on WEEX.
CRCL Stock Explained: Is Circle a Bet on the Digital Dollar?
CRCL stock is equity in USDC issuer Circle. See its IPO-to-drawdown price history, how it makes money, the Coinbase risk, and what to watch.
Claude Sonnet 5 for Crypto: What Traders Can Actually Use
Claude Sonnet 5 brings near-Opus agentic power at a lower price. Here's how crypto traders can use it for research and where it still fails.
AMD Stock in 2026: The AI Chip Bet Wall Street Can't Ignore
AMD stock trades near $543 after a blockbuster OpenAI deal and 57% data center growth. Here's what's driving the AI chip rally and the risks.
GOOG Stock Price Prediction 2026: Targets, Scenarios, and Risks
GOOG stock price prediction for 2026: current price, analyst targets near $433, bull/base/bear scenarios, and the risks every beginner should know.
Is SpaceX Publicly Traded? SPACEXPRE Price Today and SpaceX Stock Guide
SpaceX stock is one of the most searched private-market themes, but traders should separate official SpaceX equity from SPACEXPRE/USDT on WEEX. This guide reviews the SPACEXPRE price today, whether SpaceX is publicly traded, and what to consider before trading SpaceX-related exposure.
Is SOXL a Good Investment? Direxion Daily Semiconductor Bull 3X ETF Risk and Strategy Guide
SOXL offers amplified exposure to semiconductor momentum, but it is built for active traders rather than passive investors. This guide reviews whether SOXL is a good investment, when traders may consider buying, key risks, and how to trade SOXL futures on WEEX.
SOXL Price Today: Can Semiconductor Bull 3X ETF Hold $250 After 6.86% Rally?
Direxion Daily Semiconductor Bull 3X ETF futures are trading near $258.76 after a 6.86% 24-hour gain, with SOXLUSDT traders watching support around $250 and $236.46 and resistance near $272.25. This technical update reviews SOXL momentum, futures risk, key levels, and how traders can trade SOXL futures on WEEX.
BTC Price Today: Will Bitcoin Hold $58,000 or Break Lower?
Bitcoin is trading near $58,732.75 after a 2.83% 24-hour decline, with BTC/USDT spot traders watching support around $57,808.85 to $58,000 and resistance near $59,457 to $60,000. This technical update reviews BTC momentum, key levels, market data, and how traders can trade Bitcoin on WEEX.
AI Memory Supercycle Debate: Why Big Tech's Margin Panic Just Confirmed SanDisk's NAND Advantage
Why is SanDisk (SNDK) surging in 2026's AI memory supercycle? See how Apple, Microsoft, and Big Tech's margin panic confirmed NAND pricing power, plus Bernstein's $3,000 target, key risks, and what to watch next.
SNDK Stock Dip After Apple's Price Shock: Trap or Last Chance Before $3,000?
SNDK stock dipped 12%+ after Apple's price hike shock — but Bernstein just raised its target to $3,000. Is the SanDisk dip a trap or a buying opportunity? Full analysis with latest data, analyst targets, and risks.
Inside HBF: How SanDisk's High Bandwidth Flash Loads LLMs Straight Onto Hardware
What is HBF (High Bandwidth Flash)? Inside SanDisk and SK hynix's new AI memory technology that loads LLMs directly on hardware to cut inference lag, with timeline, specs, and how it differs from HBM.
Missed NVDA? Why SNDK's $1,500+ Surge Could Be the Start of the AI Storage Supercycle
Missed NVDA? See why SanDisk (SNDK) stock surged past $1,500 toward $2,000 in 2026, the AI storage supercycle driving NAND prices, analyst price targets, and key risks before you trade.
Elon Musk Reclaims Trillionaire Status: What It Means for Tesla and SpaceX Stock
Both Tesla and SpaceX stocks rallied in tandem on June 29, lifting Elon Musk back above the trillionaire…
SPCX Stock 52-Week Range: What $147 to $225 Tells You About Investor Sentiment
SPCX Stock shows a 52-week range from $147.11 (June 23) to $225.64 (June 16). That is a dramatic…
SPCX Stock and Government Contracts: How Much of SpaceX’s Revenue Actually Comes From NASA
SPCX stock is a popular search for investors hunting SpaceX exposure. While SpaceX remains private, understanding its revenue…
SPCX Stock Net Loss Explained: Why SpaceX Lost $4.28 Billion Last Quarter
SpaceX reportedly posted a $4.28 billion net loss last quarter, a sharp jump from a $0.528 billion loss…
Is Tesla Stock a Buy Before Q2 Delivery Numbers?
Tesla stock is heading into Q2 delivery numbers with a raised bar—and that’s the real story. Two major…
Nike Stock Forecast: Why Is NKE Down to $39 and Will It Recover to $50?
Nike-linked NKEUSDT futures are trading near $39.507 after a sharp intraday drop, raising the question of whether Nike stock can recover toward $50. This guide explains why NKE fell, the key support and resistance levels, and what traders should watch before trading NKE futures on WEEX.
CRCL Stock Explained: Is Circle a Bet on the Digital Dollar?
CRCL stock is equity in USDC issuer Circle. See its IPO-to-drawdown price history, how it makes money, the Coinbase risk, and what to watch.
Claude Sonnet 5 for Crypto: What Traders Can Actually Use
Claude Sonnet 5 brings near-Opus agentic power at a lower price. Here's how crypto traders can use it for research and where it still fails.
AMD Stock in 2026: The AI Chip Bet Wall Street Can't Ignore
AMD stock trades near $543 after a blockbuster OpenAI deal and 57% data center growth. Here's what's driving the AI chip rally and the risks.
GOOG Stock Price Prediction 2026: Targets, Scenarios, and Risks
GOOG stock price prediction for 2026: current price, analyst targets near $433, bull/base/bear scenarios, and the risks every beginner should know.
Is SpaceX Publicly Traded? SPACEXPRE Price Today and SpaceX Stock Guide
SpaceX stock is one of the most searched private-market themes, but traders should separate official SpaceX equity from SPACEXPRE/USDT on WEEX. This guide reviews the SPACEXPRE price today, whether SpaceX is publicly traded, and what to consider before trading SpaceX-related exposure.